
Before we get to the essence of this post, I must warn you: you are about to go down the rabbit hole. This whole field of knowledge is full of controversies and contradictions. Everyone knows there is this scary substance in our blood called cholesterol, and we need as little of it as possible, right? Oh, and everyone also knows there is bad cholesterol and good cholesterol, right? Well, just start researching it, and these seemingly commonly acknowledged notions suddenly become so very non-obvious, you might regret ever getting interested. However, we are after real health here, right? So, accepting outdated concepts that are being disproved as we speak is not our way. Be warned though: while after completing your research you may change your view on what is healthy and what is not, your doctor is likely to stay with traditional paradigm, which creates whole new margin for tensions. Many who improved their health through low carb and/or Intermittent Fasting can attest to that. Being berated by your doc for what you consider an improvement, and being pushed to take statins that horrify you more than most diseases are two common outcomes, especially at first while your weight loss journey is in progress.
I am not going to devote this post to detailed analysis of the old paradigm and new findings; books have been written about it, and trying to summarize them in a single post would be presumptuous of me and likely not very helpful. Instead, I’ll start you out with a context and a few links, and then turn to the developments which inspired this post.
To make it very brief, the context is this: Cholesterol is not a harmful substance overall, it’s a part of our internal mechanics and we would die without it. Total cholesterol number is not a very meaningful indicator of health. Breakdown of the cholesterol by good and bad is not very meaningful, as both play their role and we would die without either. Ratios where things become unfavorable are hotly contested, and the reference ranges that you’ll find on your blood work sheet aren’t quite in tune with scientific findings. A few things though seem to be proven beyond reasonable doubt. Most important among them is the role of triglycerides. Elevated triglycerides do indicate insulin resistance, cardiovascular problems, and inflammation. Also, the reference ranges on your blood work sheet are likely to be too lax, and healthy level looks to be lower than those will indicate.
First link for those who want to get deeper into these matters is from
The Triglyceride/HDL Cholesterol Ratio. What Is Ideal?
The TG/HDL-C ratio can easily be calculated from the standard lipid profile. Just divide your TG by your HDL-C.
However, when looking at the ideal ratio, you have to check if your lipid values are provided in mg/dl like in the US or mmol/L like in Australia, Canada, and most European countries.
If lipid values are expressed as mg/dl (like in the US);
TG/HDL-C ratio less than 2 is ideal
TG/HDL-C ratio above 4 is too high
TG/HDL-C ratio above 6 is much too high
If you are using mmol/L (most countries except the U.S.) you have to multiply this ratio by 0.4366 to attain the correct reference values. You can also multiply your ratio by 2.3 and use the reference values above.
If lipid values are expressed as mmol/L (like in Australia, Canada, and Europe);
TG/HDL-C ratio less than 0.87 is ideal
TG/HDL-C ratio above 1.74 is too high
TG/HDL-C ratio above 2.62 is much too high
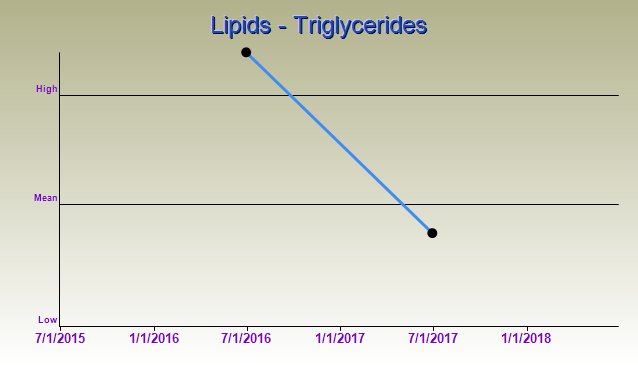
Depending on where in the world you are, use one of those sets. Being in Canada, last set of numbers is indicative for me. I expected my annual blood work with great interest, as it was first chance to see in depth the changes in my body induced by changes in my way of eating (WoE) and my weight loss. My TG/HDL ratio came to, drum roll, 0.72 – well under 0.87, upper cut-off of the ideal range. Triglycerides themselves stood at 0.85. Now, to put it in perspective, let show the number I received a year ago, when I just started my weight loss drive (3 months into it, to be exact). My triglycerides stood at 2.49(!) and TG/HDL ratio showed sky-high 3.19! Now that I stopped gasping at the fact that I managed to survive that, I can’t stop marveling at the rate of this drop. It’s mind-boggling, really. TG/HDL ratio dropped by factor 4.5, HDL rose from insufficient to a healthy level, and TG fell 3-fold. Graphically, from my lab site which has tracking analytics feature:
Needless to say, this indication of dramatic improvement in cardiovascular health leaves me, well, ecstatic. I mean, weight loss, fitting into slimmer clothes, subjective feeling of (much) improved energy etc. etc. – all this is fantastic in and of itself. Diabetes being reversed and medications being dropped – even better. I spoke of all those signs of progress here. Now this comes to confirm the general improvement and yet another extremely important aspect of health.
Let me add another link discussing whole cholesterol issue. You will also find more when researching this subject, particularly in work of Dr Aseem Malhotra. If you want to go to the book level in your research, Cholesterol Clarity: What The HDL Is Wrong With My Numbers? by Jimmy Moore and Eric Westman should give you all the information you may want. Told you, it was a rabbit hole you were about to go into!
To round it all off, if these numbers convince you to undertake the exciting Intermittent Fasting journey, you know where to find all the details!
